INTRODUCTION
In a survey of nearly 200 senior marketing managers, 71% answered that they find customer satisfaction metrics helpful in managing and monitoring their business.1 Customer satisfaction is a key performance indicator in business and often can be part of a balanced scorecard. In a competitive market, customer satisfaction can be seen as a critical differentiator and progressively becoming an essential element of business strategy where businesses competed for customers.2 Consumer satisfaction influences behavior and intention to use services that can have an impact on the organization income and profits.3 Consumer satisfaction can be related to one of the relational learning abilities. According to our previous research, the administrative skills check can reinforce the possibility that a particular part of Emotional Intelligence mixed model proportions influences success.4 In another study, we discovered that excellent leadership affected hospital managers’ performance, indicating that leaders can influence motivation, commitment, and leadership skills.5
Previous studies have identified that customer satisfaction has a significant emotional component.6 However, others suggest that customer satisfaction’s cognitive and affective components influence each other over time to determine overall satisfaction.7 A dynamic approach to customer satisfaction is essential for long-lasting goods consumed over time. Customer satisfaction can grow over time as customers use products or interact with services regularly.8 The level of satisfaction one derives from individual interactions, or transactional happiness, can impact their total cumulative contentment. According to Johnson et al., the opinions of industry professionals and the essential factor in maintaining customers over the long term is their overall contentment and also loyalty.9
Organizations need to retain existing customers while targeting noncustomers.10 Measuring customer satisfaction indicates the organization’s success in providing products and services to the market. Research on consumption experiences grows, evidence shows that consumers buy goods and services for a combination of two types of benefits: hedonic and utilitarian.11 Hedonic benefits are associated with sensory attributes and product experience. The utilitarian benefits of a product are associated with more instrumental and functional attributes of the product.12
Customer satisfaction is a nebulous and amorphous concept, and its manifestation varies from person to person and product to product or service. The level of satisfaction is influenced by several psychological and physical factors associated with satisfaction behaviors such as return rates and recommendations. Customer satisfaction levels may also differ depending on the consumer’s access to alternative products and alternatives to the organization’s offerings. Between 1985 and 1988, Parasuraman, Zeithaml, and Berry (Leonard L.) established the premise for measuring customer satisfaction with service based on the gap between customer expectations and perceived performance experience.13 The measurer is thus provided with an objective and numerical “gap” of satisfaction. Cronin and Taylor’s study created a “confirmation/disconfirmation” theory that combines the “gaps” defined by Parasuraman, Zeithaml, and Berry as two different measures (perceived and expected performance) into a single measure of expected performance.13
Service satisfaction has always been an essential topic in the service sector, whose core business operation is to provide satisfactory service to consumers. Customer satisfaction often abbreviated to CSAT is a marketing term. It measures how the products and services provided by the company meet or exceed customer expectations. Customer satisfaction is defined as “the number of customers, or percentage of total customers, whose reported experience with the company, product, or service (rating) exceeds the specified satisfaction goal.”1 Customers play an essential role in keeping a product or service relevant. Therefore, it is in the business’s best interest to ensure customer satisfaction and build customer loyalty.
Importance-performance analysis (IPA) was first introduced by Martilla and James.14 This analysis is intended to facilitate management in determining performance development priorities and interests, which are often difficult to understand because they are in the form of coefficients. In addition, researchers are often only focused on one perspective, namely, the perspective of performance or the perspective of interests.
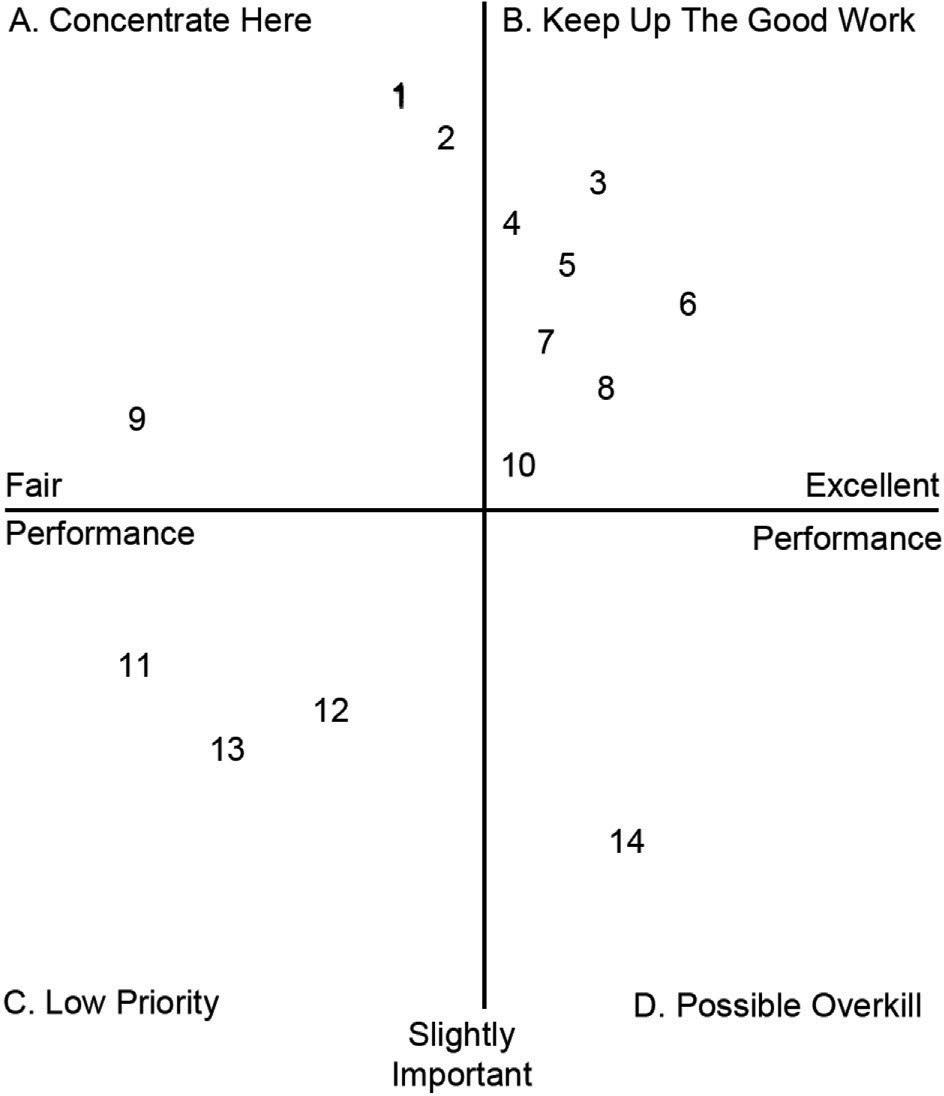
The analysis is carried out by rating the performance and importance of service and then presenting it in the form of a position map consisting of four quadrants, as shown in Figure 1. The Cartesian IPA method has a map that divides quadrants into four, namely, quadrant A, labeled concentrate here; quadrant B, labeled keep up the excellent work; quadrant C, labeled low priority; and quadrant D, labeled possible overkill. The explanation of each quadrant is as follows:
-
Quadrant A, concentrate here means that management must concentrate on developing and improving services for services whose position is in quadrant A.
-
Quadrant B, keep up the excellent work means that services whose position is already in quadrant B must maintain their performance and importance in meeting consumer expectations.
-
Quadrant C, keep up the excellent work implies that services that are already in quadrant B must maintain their performance and relevance to consumers.
-
Quadrant D, keep up the good work refers to services whose position is already in quadrant B with the expectation that they will continue to meet consumer expectations.
FIG 1. Map of importance-performance analysis.14
IPA is a very useful tool for the management to assist in decision-making.15 IPA is a tool for marketing to analyze, develop market potential, and take strategic directions. However, IPA has received criticism regarding the validity of measuring instrument development.15–17 Criticisms of the use of science as a measuring instrument include the absence of clear concepts about aspects of interest, the absence of clear criteria for the science variables, the mixed use of the terms interests and expectations, the absence of a standard scale, and the absence of a standard level of determination with regard to philosophy pertaining to strategic counsel.17 Yet, it can also be seen that IPA is a flexible measuring tool that does not have to use performance and interest rules as long as it can describe strategic needs. This study analyzes the performance of hospital services with patient satisfaction with the services provided by using the IPA analysis tool. The level of importance in this study was substituted by patient satisfaction as in the original article that the importance of a service is a reflection of customer satisfaction.14
METHODS
This study uses patient satisfaction survey data at one of the public hospitals in Central Java, Indonesia, with 572 patients as respondents. The performance and patient satisfaction variables consist of nine questions that are divided into four service aspects, namely, administrative service aspects (four questions), tangible service aspects (two questions), service aspects derived from employee performance (two questions), and intangible service aspects (two questions). The scale used is a Likert three scale, which represents “not appropriate,” “appropriate,” and “very suitable” for performance; “not satisfied,” “satisfied,” and “very satisfied” for patient satisfaction.
Table 1 shows the validity test results for the hospital service performance scale. The corrected item-total correlation (CITC) values ranged from 0.504 to 0.770. The CITC value of the variables used in the study for the performance scale >0.3 indicates that all variables are valid. Cronbach’s Alpha (CA) value of the performance scale variable is 0.898 > 0.7, which indicates it is reliable.
TABLE 1. The validity test of service performance scale
| Variable | Scale mean if item deleted | Scale variance if item deleted | Corrected item total correlation | Cronbach’s alpha if item deleted |
|---|---|---|---|---|
| KA1 | 19.260 | 9.818 | 0.553 | 0.895 |
| KA2 | 19.234 | 9.346 | 0.691 | 0.885 |
| KA3 | 19.288 | 9.092 | 0.755 | 0.880 |
| KT1 | 19.073 | 9.679 | 0.519 | 0.899 |
| KT2 | 19.285 | 9.507 | 0.681 | 0.886 |
| KK1 | 19.220 | 9.160 | 0.769 | 0.879 |
| KK2 | 19.182 | 9.165 | 0.770 | 0.879 |
| KI1 | 19.194 | 9.057 | 0.742 | 0.881 |
| KI2 | 18.934 | 9.968 | 0.504 | 0.898 |
Table 2 shows the validity test results for the patient scale of services. The CITC values ranged from 0.391 to 0.748. The CITC value of the variables used in the study for the patient satisfaction scale >0.3 indicates that all variables are valid. The CA value of the patient satisfaction scale variable is 0.879 > 0.7, which indicates that the patient satisfaction scale is reliable.
TABLE 2. The validity test of the patient satisfaction scale.
| Variable | Scale mean if item deleted | Scale variance if item deleted | Corrected item total correlation | Cronbach’s alpha if item deleted |
|---|---|---|---|---|
| SA1 | 19.056 | 11.076 | 0.587 | 0.873 |
| SA2 | 19.168 | 10.248 | 0.698 | 0.863 |
| SA3 | 18.914 | 11.987 | 0.641 | 0.865 |
| ST1 | 18.771 | 12.685 | 0.391 | 0.885 |
| ST2 | 18.949 | 11.996 | 0.709 | 0.861 |
| SK1 | 18.839 | 11.760 | 0.740 | 0.858 |
| SK2 | 18.818 | 11.736 | 0.748 | 0.857 |
| SI1 | 18.844 | 11.767 | 0.706 | 0.860 |
| SI2 | 18.626 | 12.340 | 0.552 | 0.872 |
Based on the results of the validity and reliability of the performance variable scale and patient satisfaction, it can be said that there is no problem with the validity or reliability of the measurement scale, as happened in previous studies.15–17
RESULTS AND DISCUSSION
The level of performance-patient satisfaction is the same as the scale used in the patient satisfaction survey, namely, the minimum is one and the maximum is three. This range value has a median of two, which is used as the limit for determining the level of performance satisfaction. Scores >2 are classified as high, and scores <2 are classified as low.
Table 3 shows the level of performance satisfaction in aspects of administrative services. The level of performance of all service units is already high, as indicated by a performance score of >2. However, patient satisfaction is still low for the treatment requirements of several units, such as the emergency department, maternity, radiology, and rehabilitation. In the treatment procedure, the level of satisfaction in the pharmacy, emergency room, laboratory, maternity, and radiology units is still low. The speed of service has earned a high level of satisfaction.
TABLE 3. Level of performance-satisfaction of service unit administrative aspect.
| No | Service units | Performance | Satisfaction | ||||
|---|---|---|---|---|---|---|---|
| Terms | Procedur | Speed | Terms | Procedur | Speed | ||
| 1 | Pharmacy | 2.19 | 2.27 | 2.22 | 2.29 | 1.61 | 2.25 |
| 2 | Emergency room | 2.28 | 2.23 | 2.18 | 1.96 | 1.90 | 2.56 |
| 3 | Laboratorium | 2.11 | 2.11 | 2.11 | 2.22 | 1.78 | 2.56 |
| 4 | Maternity | 2.29 | 2.32 | 2.21 | 1.94 | 1.47 | 2.26 |
| 5 | Radiology | 2.32 | 2.16 | 2.19 | 1.84 | 1.84 | 2.52 |
| 6 | Inpatient | 2.33 | 2.45 | 2.36 | 2.33 | 2.32 | 2.22 |
| 7 | Outpatient | 2.43 | 2.48 | 2.48 | 2.42 | 2.39 | 2.20 |
| 8 | Rehabilitation | 2.37 | 2.31 | 2.14 | 1.94 | 2.18 | 2.51 |
Figure 2 shows the IPA map for the performance- satisfaction of service units in administrative services. All units are on the right side of the performance line, which means that they already have high performance, but some units are below the satisfaction line where these units have a low level of patient satisfaction. Units that are still below the satisfaction line must be the hospital’s focus to improve services so that they can meet patients’ expectations.
FIG 2. Importance-performance analysis map of administrative service performance-satisfaction.
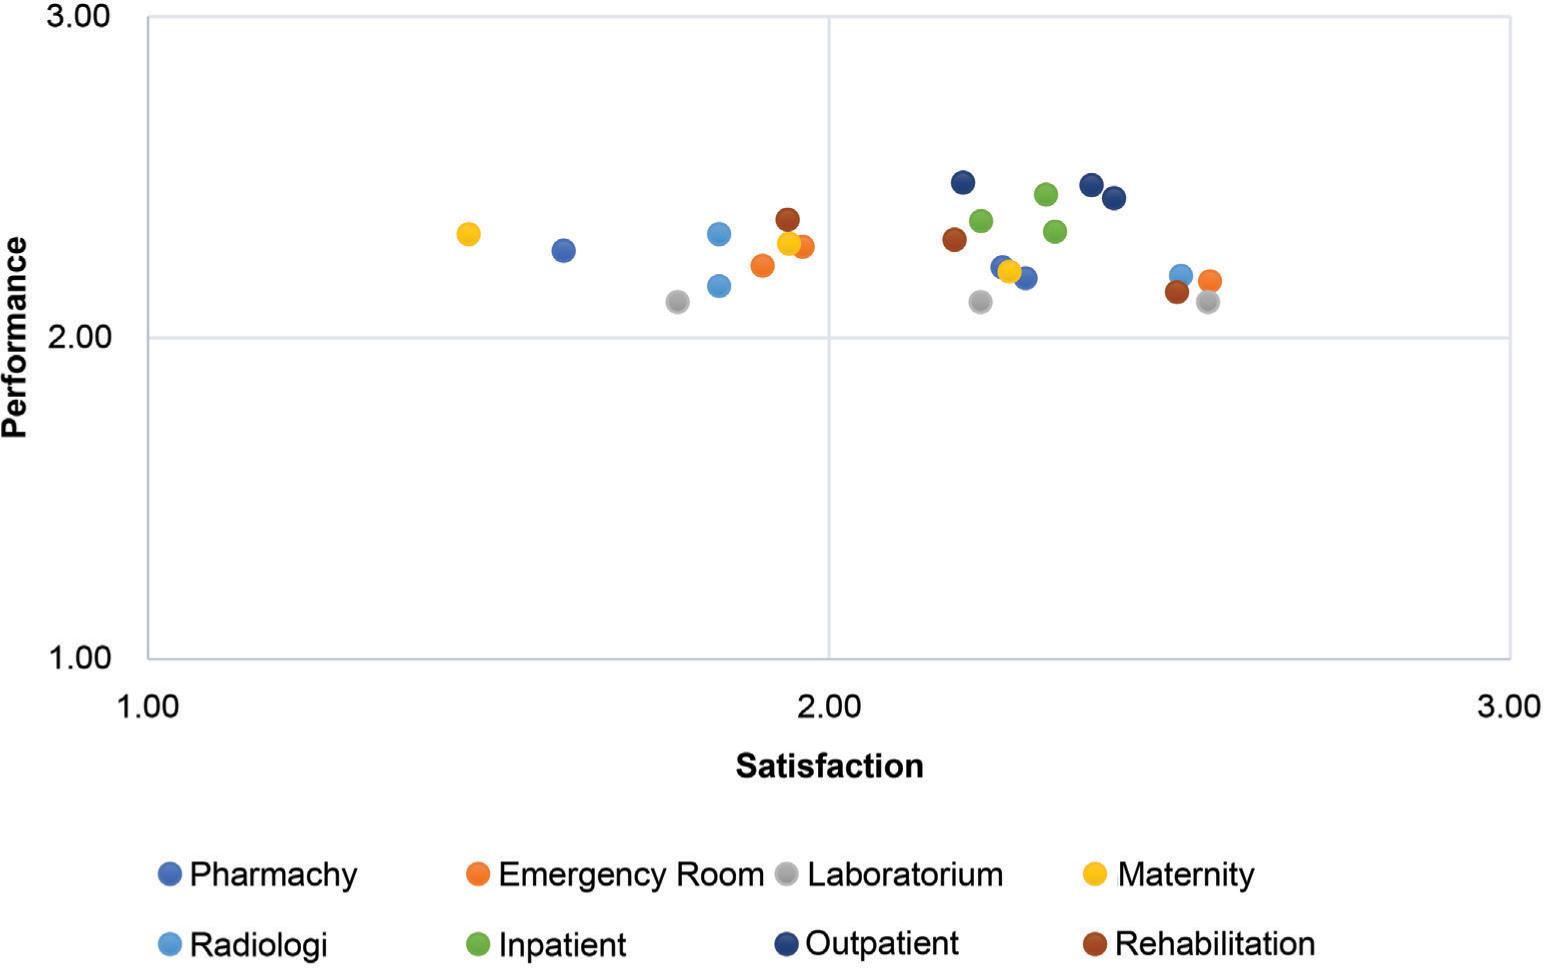
Table 4 shows the performance-satisfaction level score for the tangible services. All service units, regarding tariffs and product standards, already have a high level of performance and satisfaction, as indicated by a performance score >2 and satisfaction >2.
TABLE 4. Level of performance-satisfaction of unit aspects of tangible services.
| No | Service units | Performance | Satisfaction | ||
|---|---|---|---|---|---|
| Tariff | Product Standard | Tariff | Product Standard | ||
| 1 | Pharmacy | 2.58 | 2.25 | 2.25 | 2.25 |
| 2 | Emergency room | 2.44 | 2.22 | 2.33 | 2.33 |
| 3 | Laboratorium | 2.39 | 2.17 | 2.44 | 2.39 |
| 4 | Maternity | 2.53 | 2.24 | 2.32 | 2.21 |
| 5 | Radiology | 2.65 | 2.10 | 2.35 | 2.39 |
| 6 | Inpatient | 2.38 | 2.33 | 2.72 | 2.24 |
| 7 | Outpatient | 2.56 | 2.49 | 2.45 | 2.34 |
| 8 | Rehabilitation | 2.82 | 2.16 | 2.53 | 2.35 |
In Figure 3, all units are above the satisfaction line and to the right of the performance line. This shows that the performance-satisfaction of the service unit for tangible services is already high.
FIG 3. Importance-performance analysis map of performance-satisfaction tangible service.
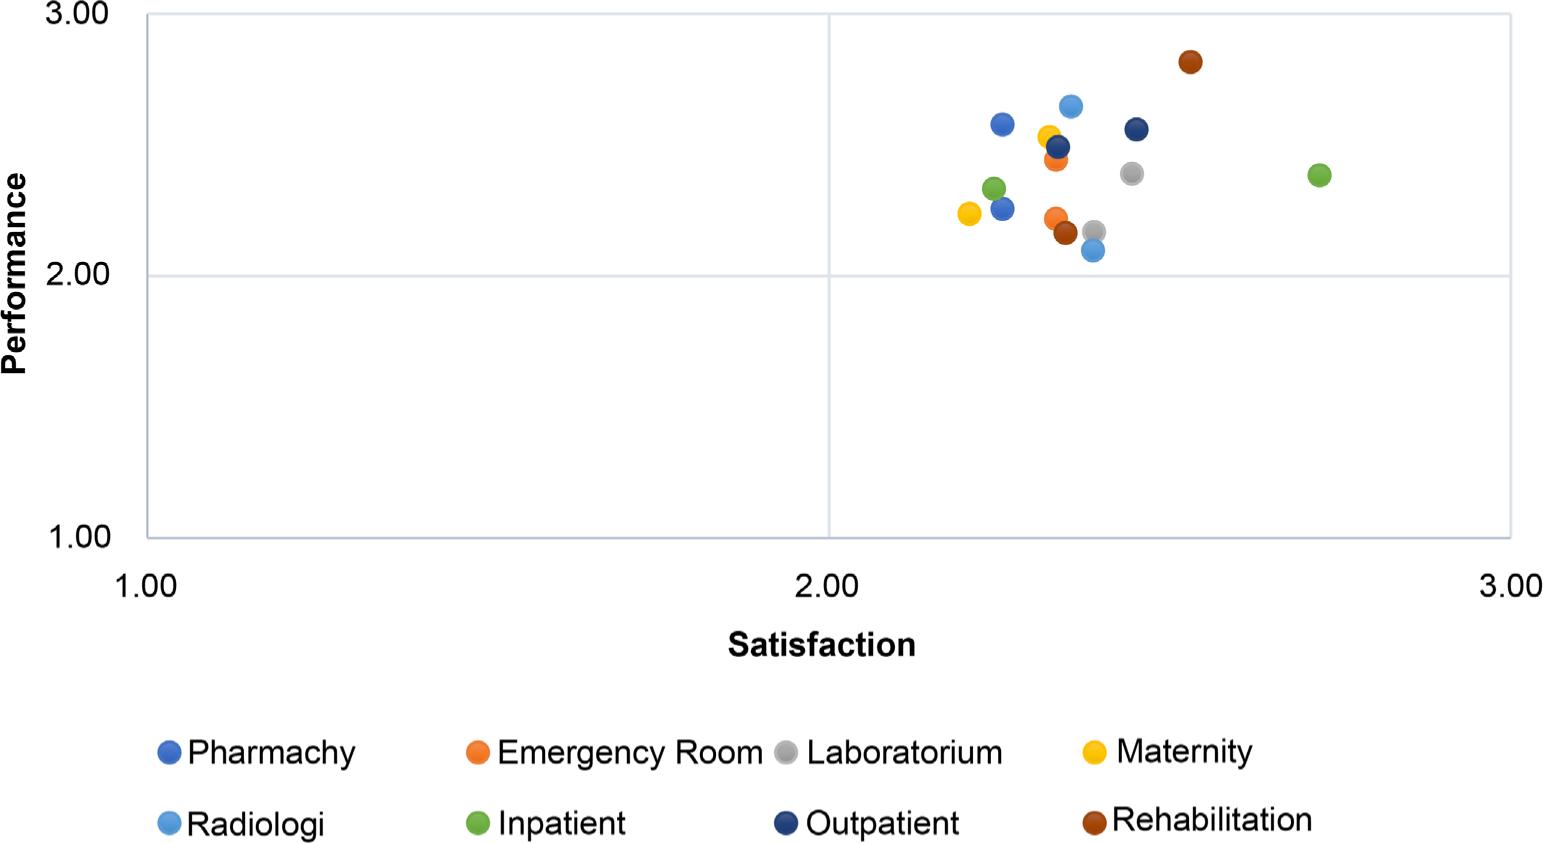
Table 5 shows the performance-satisfaction level scores for the performance of the hospital employees. In terms of officer competence and officer behavior, all service units already have a high level of performance and satisfaction, indicated by a performance score >2 and satisfaction >2.
TABLE 5. Level of performance-satisfaction of service unit aspects of employee performance.
| No | Service units | Performance | Satisfaction | ||
|---|---|---|---|---|---|
| Competence | Behavior | Competence | Behavior | ||
| 1 | Pharmacy | 2.31 | 2.25 | 2.31 | 2.29 |
| 2 | Emergency room | 2.36 | 2.35 | 2.51 | 2.51 |
| 3 | Laboratorium | 2.39 | 2.50 | 2.56 | 2.56 |
| 4 | Maternity | 2.21 | 2.26 | 2.32 | 2.32 |
| 5 | Radiology | 2.39 | 2.39 | 2.52 | 2.48 |
| 6 | Inpatient | 2.34 | 2.41 | 2.32 | 2.41 |
| 7 | Outpatient | 2.49 | 2.56 | 2.43 | 2.44 |
| 8 | Rehabilitation | 2.29 | 2.35 | 2.49 | 2.45 |
In Figure 4, all units are above the satisfaction line and to the right of the performance line. The fact that this is the case demonstrates that the performance satisfaction of the service unit for concrete services is already high.
FIG 4. Importance-performance analysis map of employee performance-satisfaction.
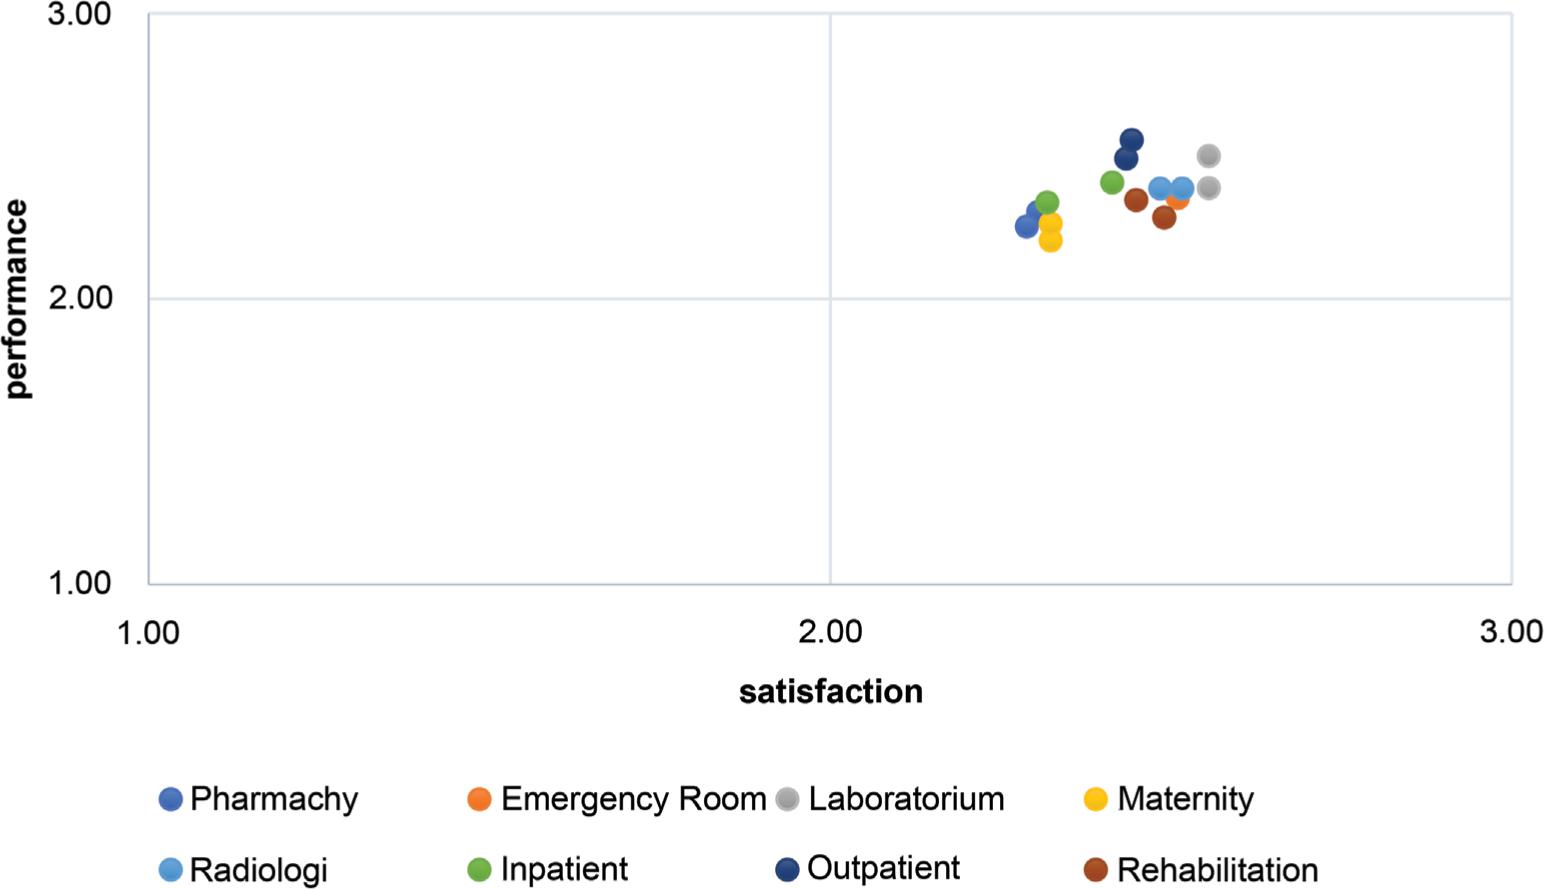
Table 6 shows the performance-satisfaction level score for intangible services. All service units, in terms of facilities, infrastructure, and complaint services, already have a high level of performance and satisfaction, indicated by a performance score >2 and satisfaction >2.
TABLE 6. Level of performance-satisfaction of hospital service unit aspects of intangible services.
| No | Service units | Performance | Satisfaction | ||
|---|---|---|---|---|---|
| S&P | LP | S&P | LP | ||
| 1 | Pharmacy | 2.24 | 2.88 | 2.29 | 2.25 |
| 2 | Emergency room | 2.30 | 2.84 | 2.48 | 2.40 |
| 3 | Laboratorium | 2.17 | 2.67 | 2.50 | 2.67 |
| 4 | Maternity | 2.15 | 2.82 | 2.26 | 2.21 |
| 5 | Radiology | 2.32 | 2.74 | 2.52 | 2.52 |
| 6 | Inpatient | 2.46 | 2.38 | 2.29 | 2.88 |
| 7 | Outpatient | 2.58 | 2.59 | 2.47 | 2.83 |
| 8 | Rehabilitation | 2.35 | 2.82 | 2.57 | 2.53 |
In Figure 5, all units are above the satisfaction line and to the right of the performance line. It shows that the performance-satisfaction of the service unit for tangible services is already high.
FIG 5. Importance-performance analysis map of intangible service satisfaction.
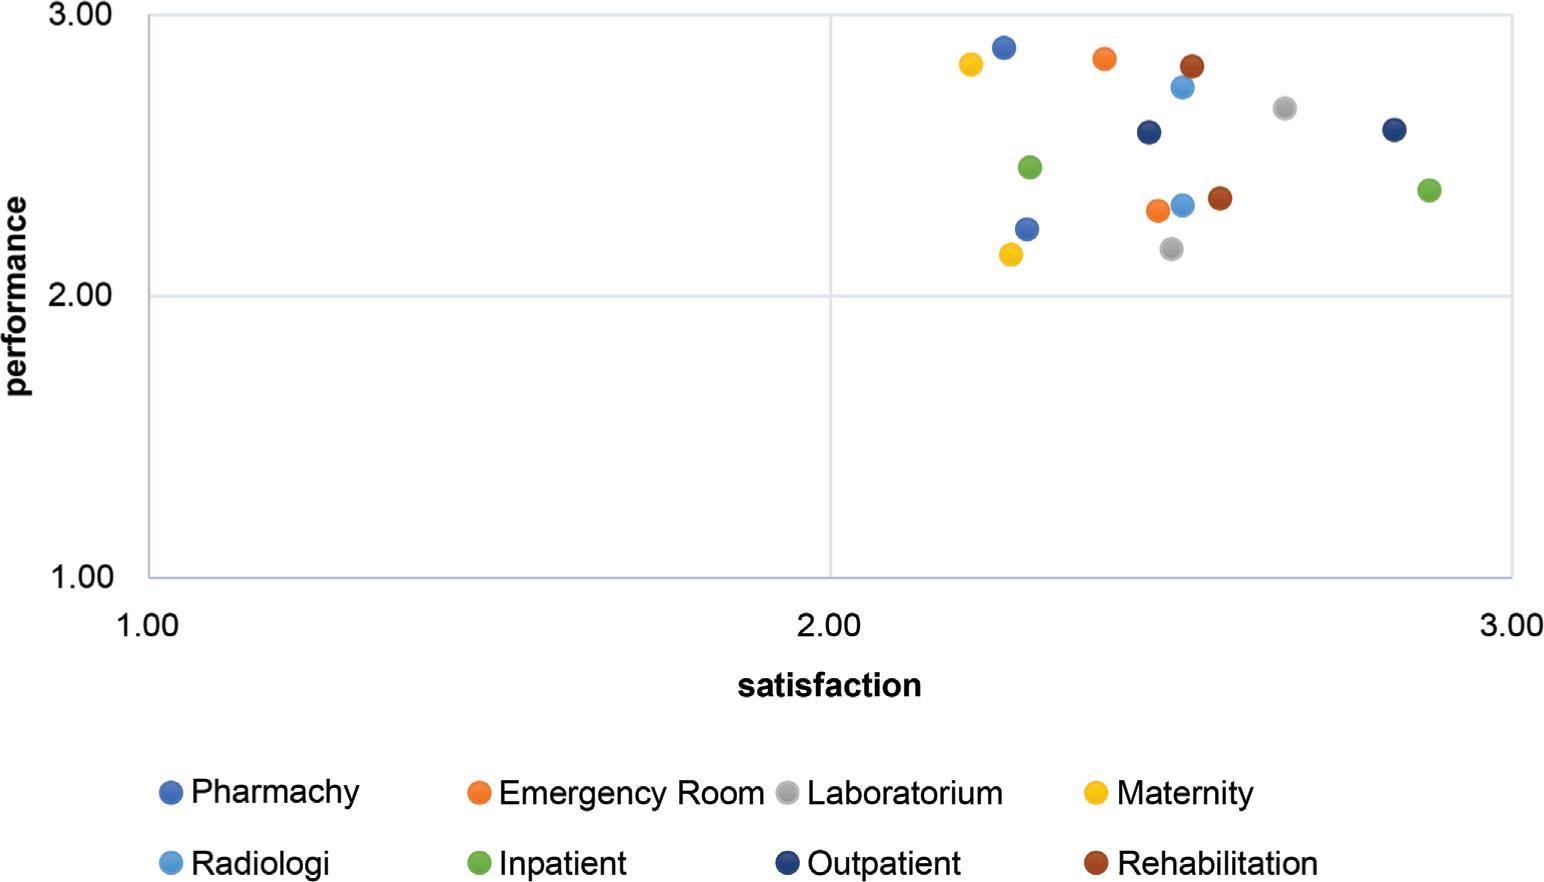
Table 7 displays the performance-satisfaction level scores for components of hospital’s services. Due to the score range of 1–8, the service standard of performance and customer satisfaction is a 4 out of 8. All service units already have a high level of performance and satisfaction, as evidenced by performance scores more significant than 4 and satisfaction scores greater than 4.
TABLE 7. Level of performance-satisfaction of hospital service unit.
| No | Service units | Performance | Satisfaction | ||||||
|---|---|---|---|---|---|---|---|---|---|
| HA | HT | HE | HI | HA | HT | HE | HI | ||
| 1 | Pharmacy | 6.68 | 4.83 | 4.56 | 5.12 | 6.15 | 4.51 | 4.59 | 4.54 |
| 2 | Emergency room | 6.69 | 4.66 | 4.72 | 5.15 | 6.42 | 4.67 | 5.02 | 4.88 |
| 3 | Laboratorium | 6.33 | 4.56 | 4.89 | 4.83 | 6.56 | 4.83 | 5.11 | 5.17 |
| 4 | Maternity | 6.82 | 4.76 | 4.47 | 4.97 | 5.68 | 4.53 | 4.65 | 4.47 |
| 5 | Radiology | 6.68 | 4.74 | 4.77 | 5.06 | 6.19 | 4.74 | 5.00 | 5.03 |
| 6 | Inpatient | 7.14 | 4.71 | 4.75 | 4.83 | 6.87 | 4.96 | 4.73 | 5.17 |
| 7 | Outpatient | 7.39 | 5.05 | 5.05 | 5.17 | 7.00 | 4.79 | 4.88 | 5.30 |
| 8 | Rehabilitation | 6.82 | 4.98 | 4.63 | 5.16 | 6.63 | 4.88 | 4.94 | 5.10 |
HA, Hospital Administratif; HT, Hospital Tangible; HE, Hospital Employee; HI, Hospital Intangible.
In Figure 6, all units are above the satisfaction line and to the right of the performance line. It shows that the performance satisfaction of the service units is already high. However, it is necessary to pay attention to service units with a score range of 4 to 5.5 performance-satisfaction to improve performance and fulfillment of patient satisfaction.
FIG 6. Importance-performance analysis map of service performance-satisfaction.
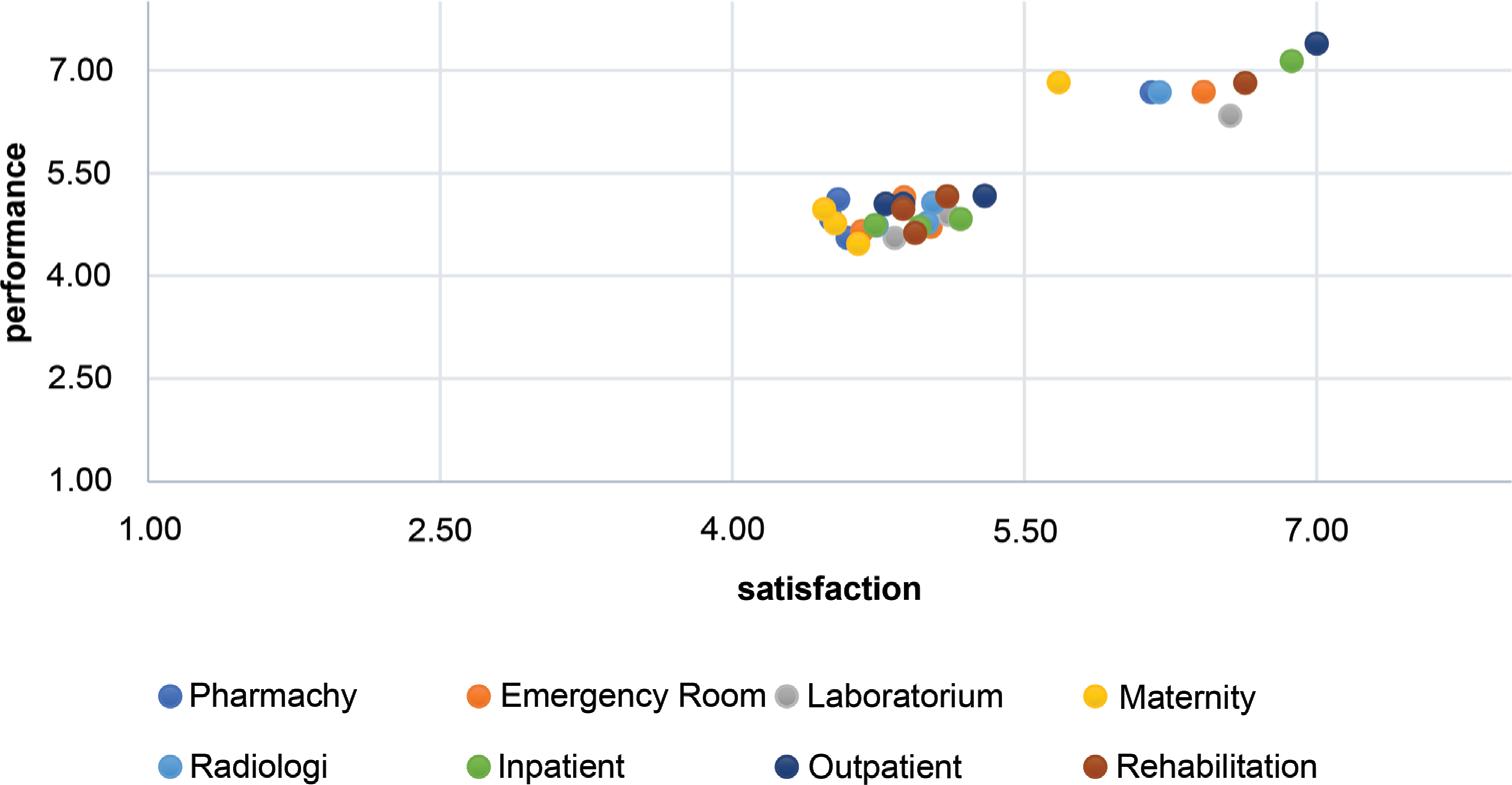
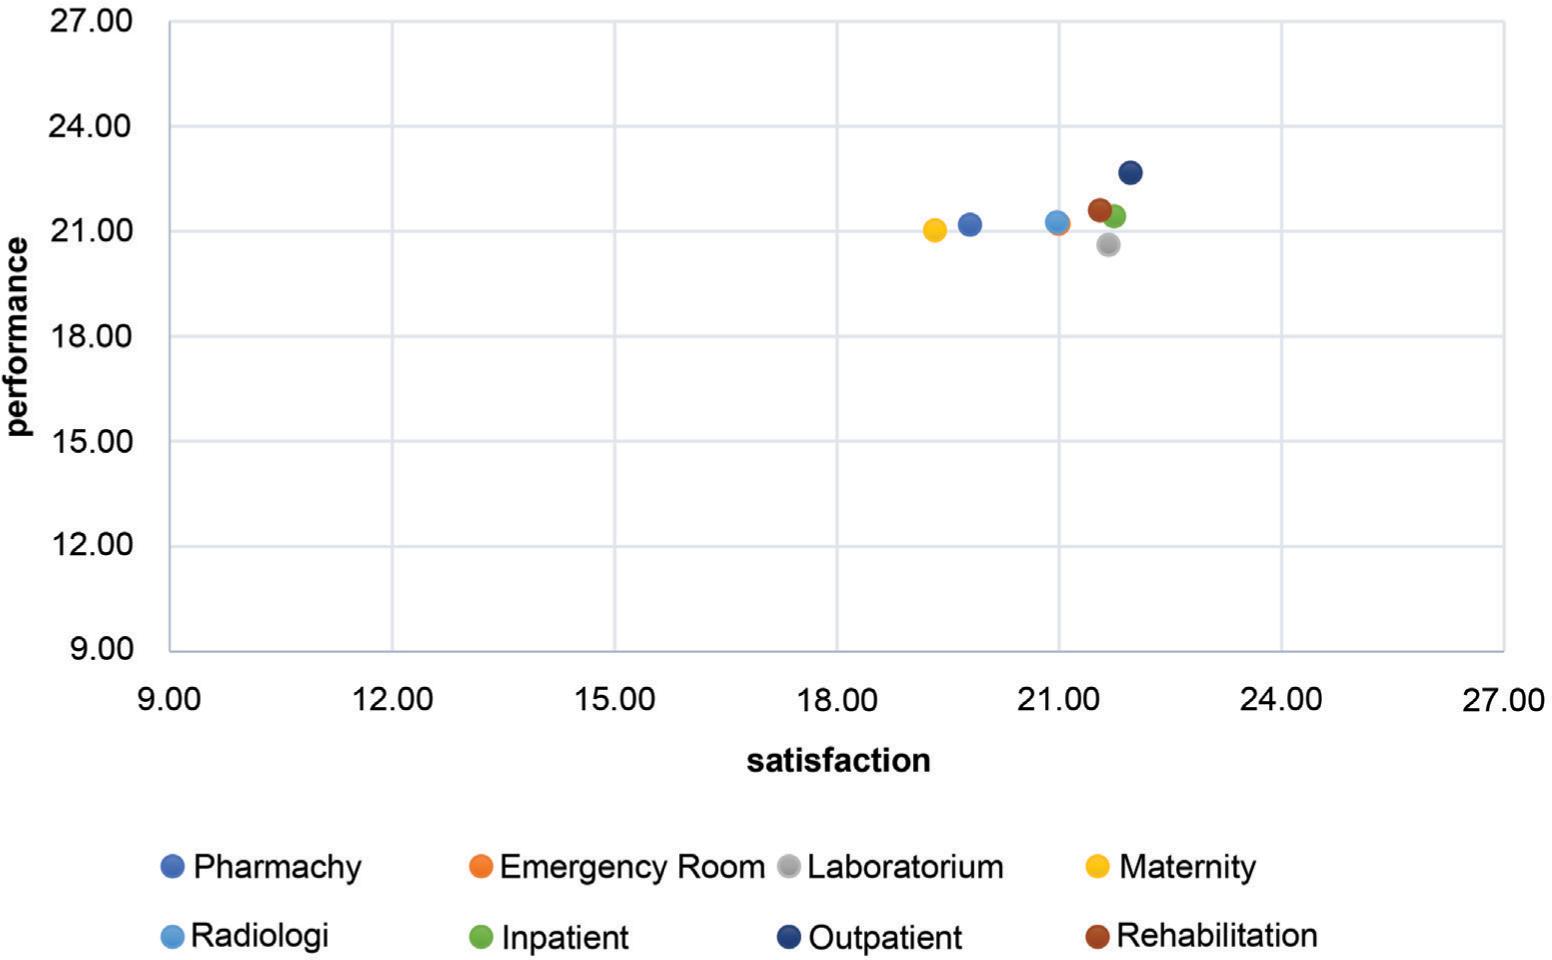
Table 8 displays the total value for the level of performance satisfaction in the hospital’s service units. The total value of performance satisfaction ranges from 9 to 27, with an average of 18 points. Therefore, a performance-satisfaction score above 18 shows that the service unit’s performance and satisfaction are already high. All service units have demonstrated performance and satisfaction scores above 18, indicating that both are already high.
TABLE 8. Level of performance-satisfaction of the hospital service unit total service.
| No | Service units | Performance | Satisfaction |
|---|---|---|---|
| 1 | Pharmacy | 21.19 | 19.80 |
| 2 | Emergency room | 21.21 | 20.99 |
| 3 | Laboratorium | 20.61 | 21.67 |
| 4 | Maternity | 21.03 | 19.32 |
| 5 | Radiology | 21.26 | 20.97 |
| 6 | Inpatient | 21.43 | 21.74 |
| 7 | Outpatient | 22.66 | 21.96 |
| 8 | Rehabilitation | 21.59 | 21.55 |
Figure 7 shows the IPA map for the total performance-satisfaction for service units. As can be seen, all units are above the performance and satisfaction line, which shows that all units have high performance and satisfaction. It is just that the hospital must pay attention to the unit whose position is below to improve both performance and achievement of patient satisfaction.
FIG 7. Importance-performance analysis map of total performance-satisfaction.
Based on the results of IPA through a patient satisfaction survey at hospital, it is evident that all service units’ performance has high-performance ratings. In the context of administrative services, there are still units with a low level of satisfaction. In relation to these outcomes, the application of work standards to the delivery of health services must meet the expectations of patients.
The hospital has organizational goal standards that have been determined by the management. The organizational goals should be aligned with patients’ expectations who in this case are the hospital’s consumers. Hospital programs and work plans should not mislead or even conflict with consumer expectations. This is a vital aspect to use public relations (PR) that link hospitals and patients to ensure conformance between the performance standards set by the organization and the expectation that it will give patient satisfaction.
Modern businesses have to work and be adaptive in an environment that is less predictable, moves faster, and has more moving parts.18 The customer is an essential part of any business. Measuring the extent to which they are happy with the service provided is a crucial part of any strategy designed to increase a company’s likelihood of being profitable. A firm needs to increase its ability to compete for customer satisfaction by retaining more customers and also attaining better levels of customer happiness.19 Customer loyalty is the single most significant factor in determining whether or not a company will be victorious throughout its existence. Businesses can maintain lower costs than the costs of acquiring new customers due to the loyalty of their existing customers. Loyal customers can add to the firm’s worth and allow it to maintain lower costs. Organizations can build a long-term relationship with their customers, which is mutually beneficial, by first developing their customers’ loyalty and then retaining it as the foundation for their relationship.20
The comparison of the appraisal of customer- level satisfaction from the firm’s and customer’s perspectives reveals several significant discrepancies that should be considered. The disparities between the enterprises are evident not just in their overall success but also in their differences. Businesses are responsible for ensuring that the ratings they give themselves are in line with the assessments provided to them by their customers.21 It was discovered that the customers’ contentment has a causal relationship with the employees’ contentment as well as an understanding of the employees’ contentment.22,23 Businesses make it a point to determine how satisfied their customers are and to check if their performance levels are up to the standards that they have established.24
As soon as it comes to the provision of medical care, the degree to which patients are pleased with their care is proportional not only to the effectiveness of the Human Resources and Development department but also to the sense of satisfaction that is felt by the staff members of the respective hospitals.25,26 Three components of healthcare quality need to be emphasized: the quality of the outcomes, the protection of patient rights and privacy, and the quality of the services offered.27 On the other hand, in terms of the overall performance of private hospitals, the servicescape quality domain requires strategic planning to establish itself as a distinct selling point.28
CONCLUSION
IPA is a valuable tool that assists the management in determining priorities for developing a service. Because there are no standard variables or scales, this analytical tool can become a standard to obtain variables and scales. When compared with pervious research, this study identifies that there are no validity issues with the measurement scale. Our finding that all units are on the right side of the performance line, indicates that they are already performing well. However, some units are below the satisfaction line, indicating low patient satisfaction. All service units’ performance results already had high-performance ratings based on IPA and patient satisfaction as measured by a patient satisfaction survey at the hospital.